

In this week’s blog installment, we delve into the most powerful capability of the DOE component which is regression analysis. This is the most powerful utility of the DOE component and can be used in several different ways.
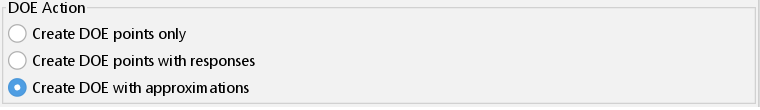
Put simply, regression means creating statistically valid mathematical relationships between the inputs and outputs. These relationships either create linkages that did not exist before or are a simpler alternative to existing complex mathematical equations. To use the DOE component for regression analysis, we have to select the ‘Create DOE with approximations’ radio button.
This is followed by selecting the desired regression model to be used.
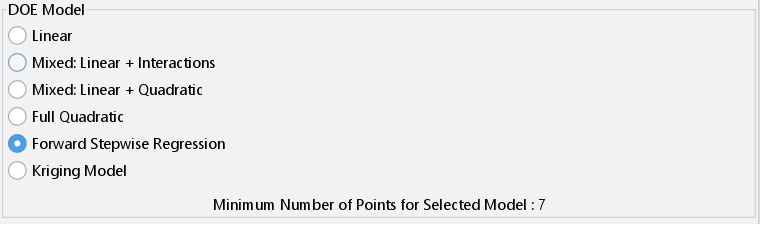
Iliad currently offers a choice between first and second order polynomial regression models and interpolation models. The execution begins in the same way as the ‘Create DOE points with responses’ mode which was described in last week’s article; multiple design points are created and evaluated. Next, using the design points and the corresponding output values, a regression model is fitted. In the case of our beam example, this would result in design points that can be plotted on a graph using the 3D approximation viewer tool.

The 3D approximation viewer also displays the equations for the regression model at the bottom. These equations can be visualized in the form of a response surface.
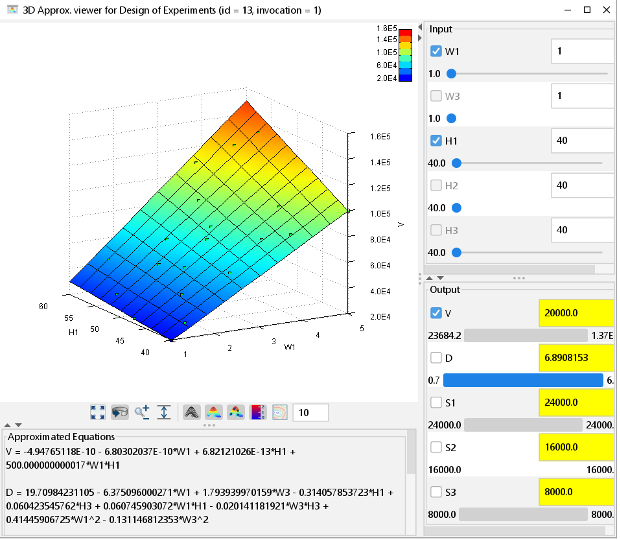
Moreover, the user can interact with the response surface model and see the effect changing one or more parameters would have on the responses. This is a very powerful feature that can be used for improving the design or process solution. That’s all for this week! See you next week with another installment on the DOE component.