

Iliad is equipped with different types of monitors which track and display the relevant metrics for a study. These monitors can easily be added and configured by switching to the ‘Simulation Monitors’ tab.
There are multiple optimization monitor types in Iliad; Generic monitor, Optimization History tracker, Pareto plots, Optimization History monitors. Additionally, there are certain DOE specific monitors including Actual vs Predicted, correlation, residual and statistical plots.
For an optimization study, an optimization history monitor is created by default for the first objective.
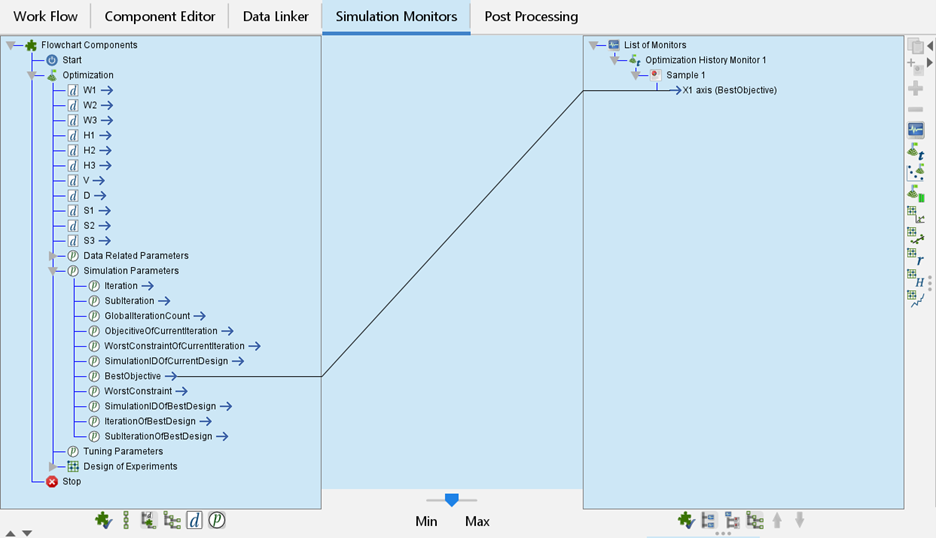
Figure 1. Optimization History Monitor created by default
Additional monitors can be created by clicking on the desired icon on the right-hand side toolbar. More than one variable can be plotted on the same graph by using the ‘add a sample’ button.
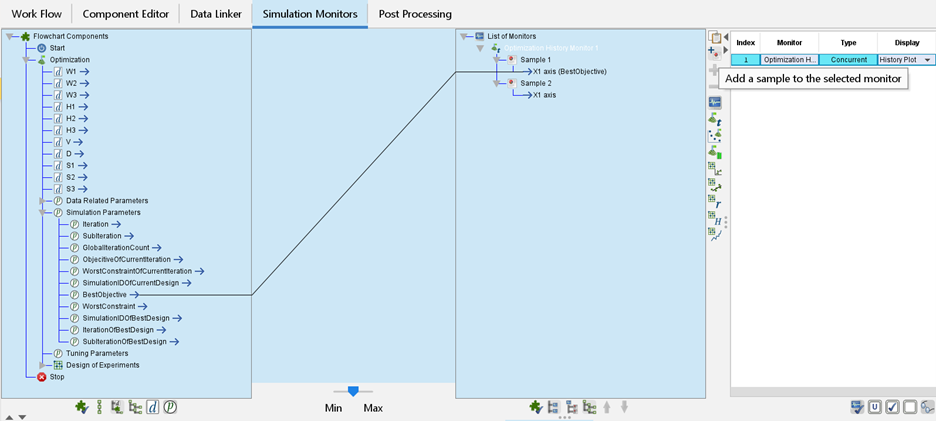
Figure 2. Adding multiple variables to the same monitor
To configure a plot, expand the tree on the left-hand side and draw connections between the variables and the samples in the right-hand side tree. In addition to the variables themselves, data related parameters and simulation parameters can also be plotted and are usually recommended in case the user has no preferences.
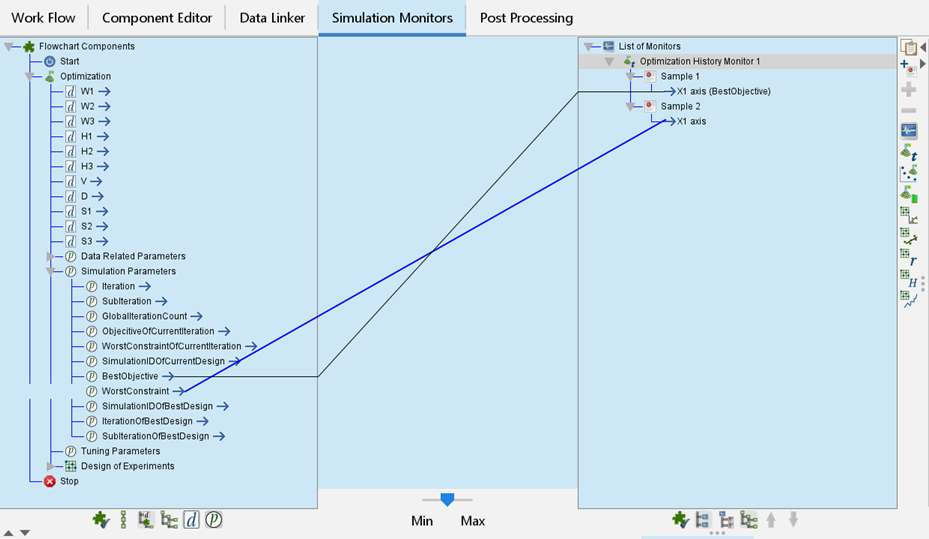
Figure 3. Configuring simulation monitors
To view the monitors, switch to the ‘View Monitors’ tab in the bottom panel. For optimization studies, the plot markers represent a design cycle rather than each individual design point for space saving and noise reduction.
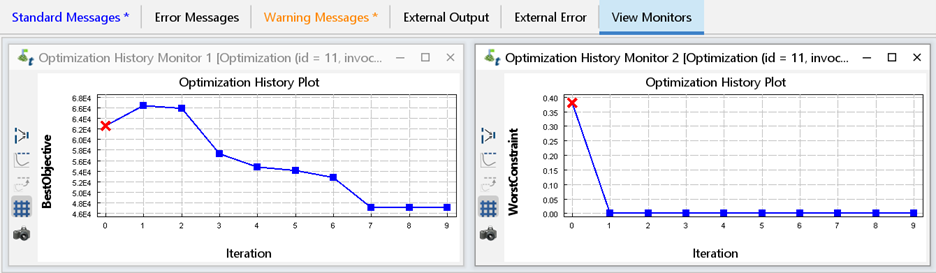
Figure 4. Monitors displayed in the ‘View Monitors’ tab
The Generic monitor is special because it can be configured to display a table, parallel chart or scatter data.
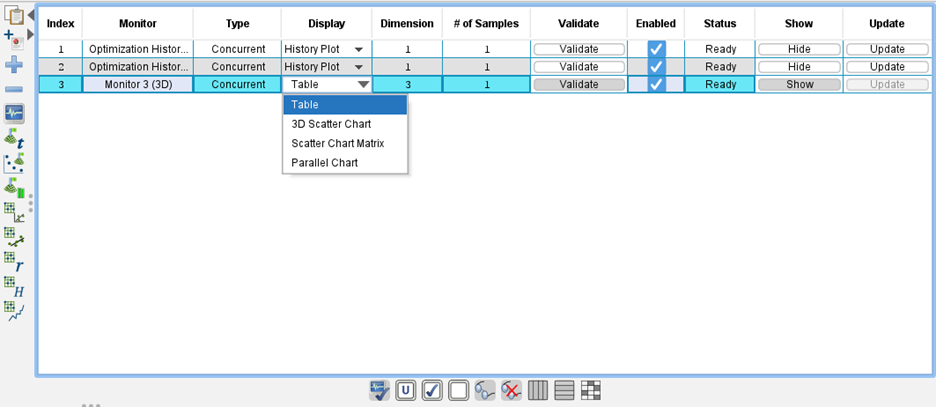
Figure 5. Configuring the Generic monitors
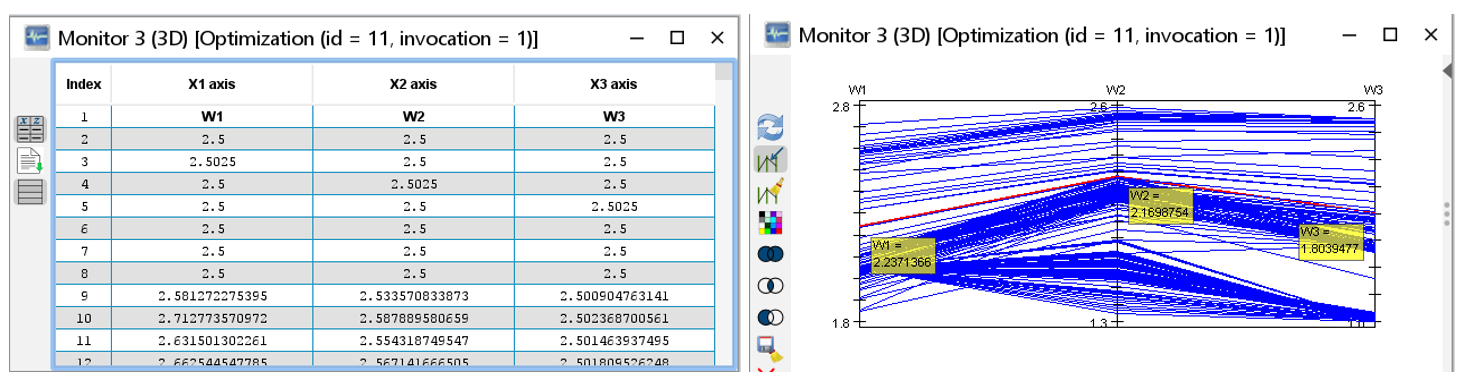
Figure 6. Generic monitor configured as table (left) and parallel chart (right)
Another one of the many simple yet powerful features of Iliad.